
Food waste under control with clear data and concrete actions
Qubi helps you read waste as an operational problem, not as a vague figure at the end of the month. Value lost, total weight, causes and worst offending products become information you can use to cut losses.
What you can analyse about waste
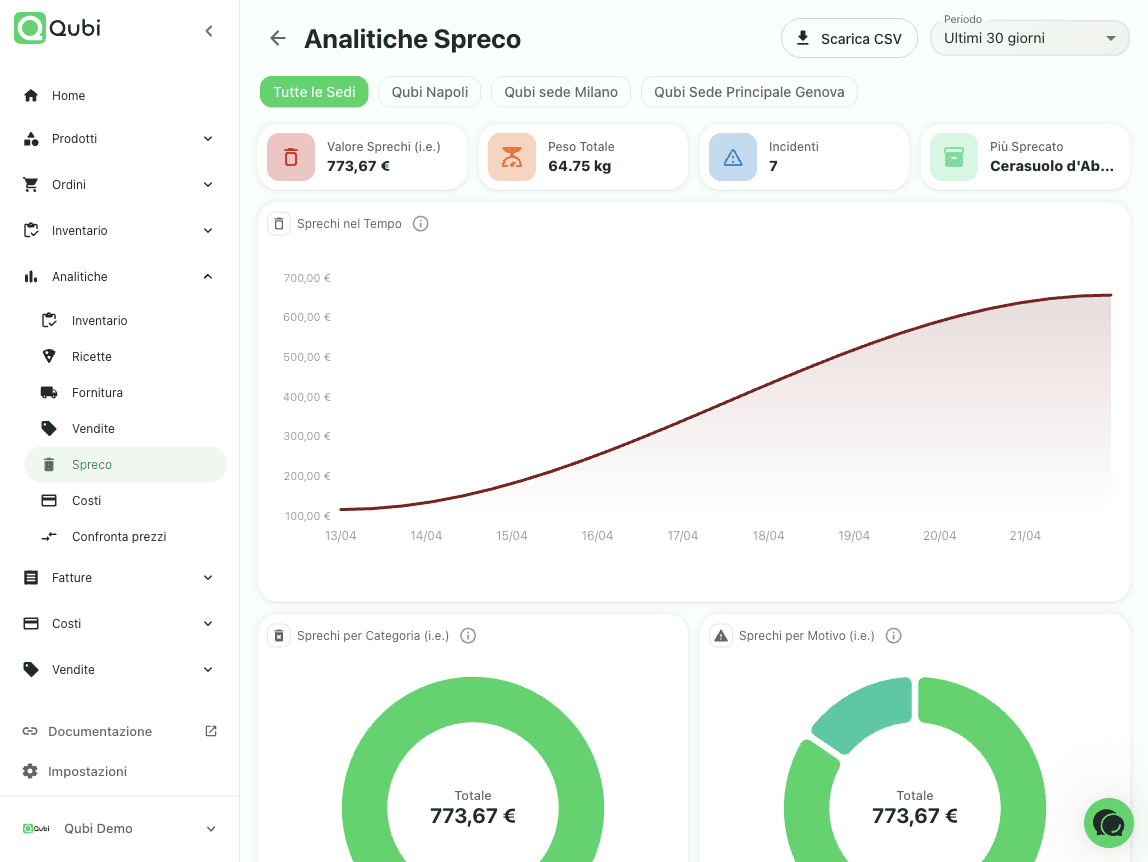
Value and weight thrown away
You do not just see what is missing from the shelf: you see how much it actually costs you at the end of the month.
Products that waste most
Find quickly which items absorb the most lost value, and which ones account for the most kilos in the bin.
Causes and incidents
Understand whether the problem comes from expiry dates, mistakes during service or gaps found at stock count.
Readable, exportable dashboard
Charts, KPIs and CSV exports help the team turn the numbers into a routine that actually improves things.
Breakdown by product category
See whether the loss is concentrated in a few families of products, so the fix can be targeted instead of generic.
Useful across several sites
Filters and dedicated views make it easy to compare waste between locations, teams and working habits.
The problem becomes visible at a glance
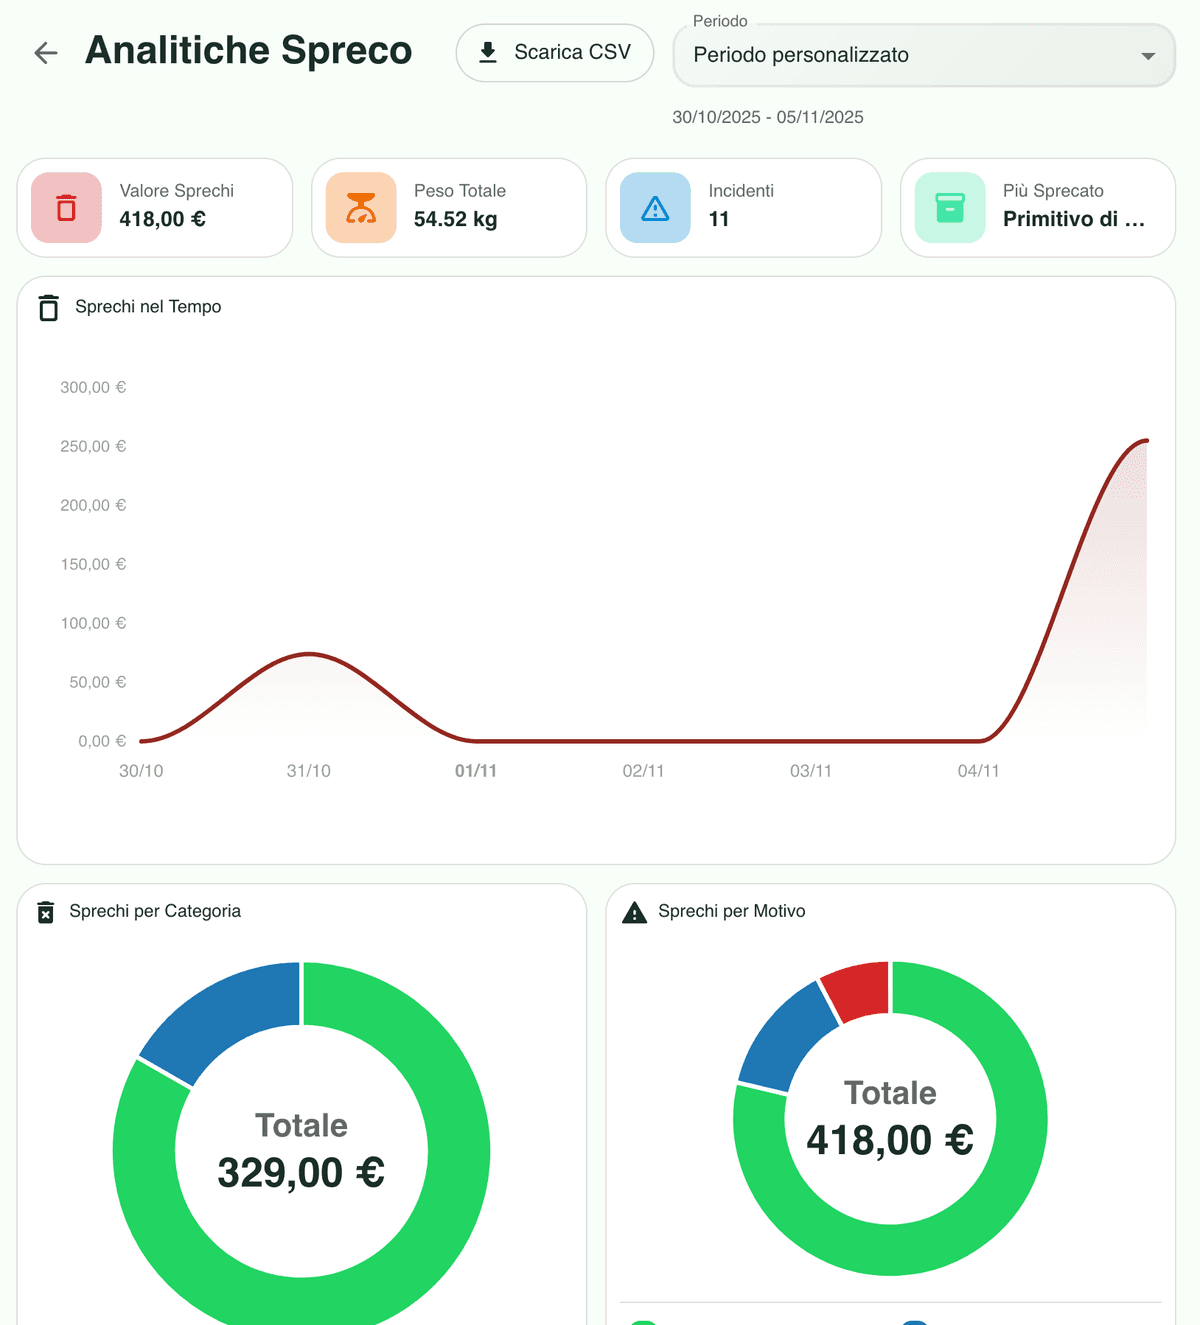
When value lost, total weight, incidents and the most critical product appear side by side, it is much easier to see where attention belongs. The dashboard does not only tell you that margin disappeared: it shows where and how it happened.
Waste by reason and category, not just a final total
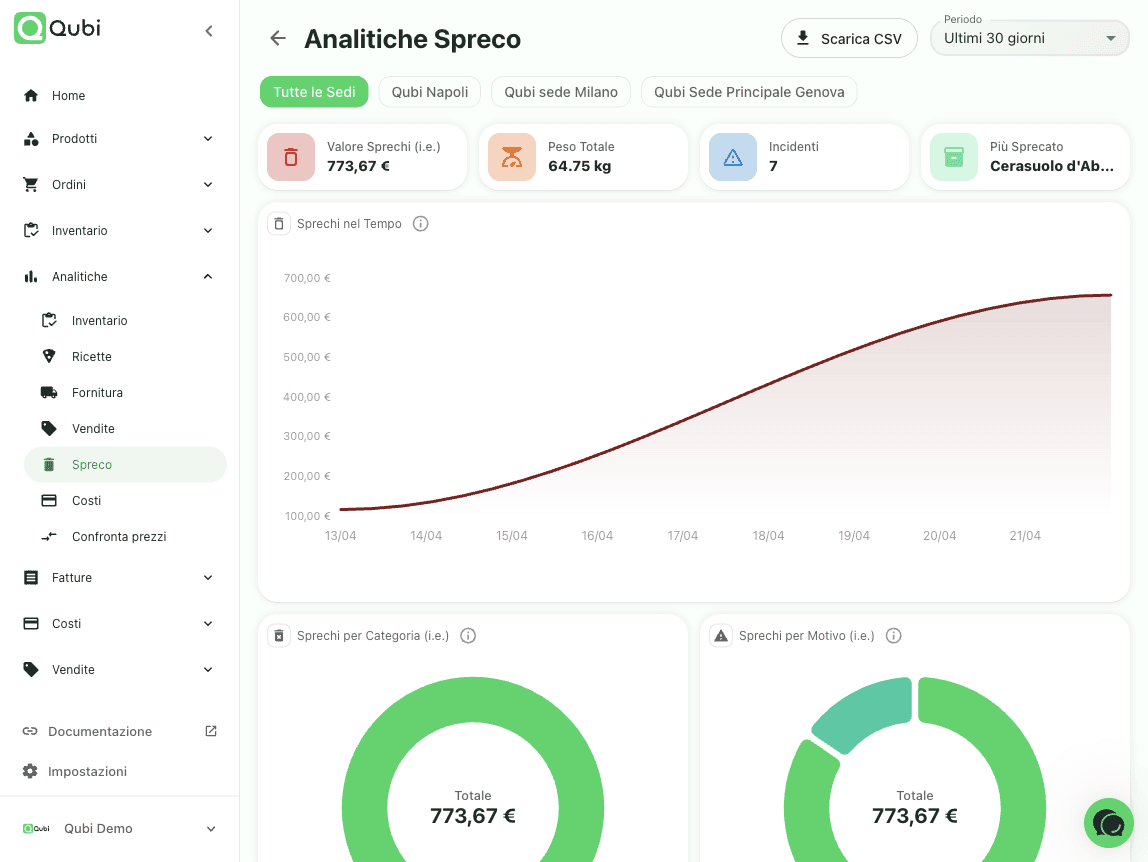
A total is useful, but it is not enough. Qubi splits the figure by category and by reason, so you can tell whether the loss starts in the store room, during prep, at delivery or in service, and deal with the right one.
A view that also improves counting and the store room
Waste gets far more interesting once you connect it to stock levels and the differences that show up at count. The feature is strong because it does not live on its own: it belongs to a wider system that keeps losses down over time.

Food waste software FAQ
Practical answers about reading waste data and turning it into a routine that sticks.
Does Qubi only measure the money lost to waste?
No. The dashboard brings together the value lost, the total weight, the number of incidents and the worst offending product, which makes the problem far easier to read than a single figure at the end of the month.
Can I see why the waste happened?
Yes. Waste is broken down by reason and by category, so a number on a chart connects to something concrete you can change in the kitchen, at delivery or in the store room.
Is it useful for comparing different sites?
Yes. Qubi works with location filters, so a group can compare how much each site loses and how those losses differ between teams and routines.
Is waste connected to stock?
Yes. Waste is not an isolated report at the end of the period: it sits inside the flow that runs from stock levels to counting and analytics, so a write-off keeps your stock figures honest.